
If a picture is worth a thousand words,— Qroft —
then a chart is worth a thousand pictures.
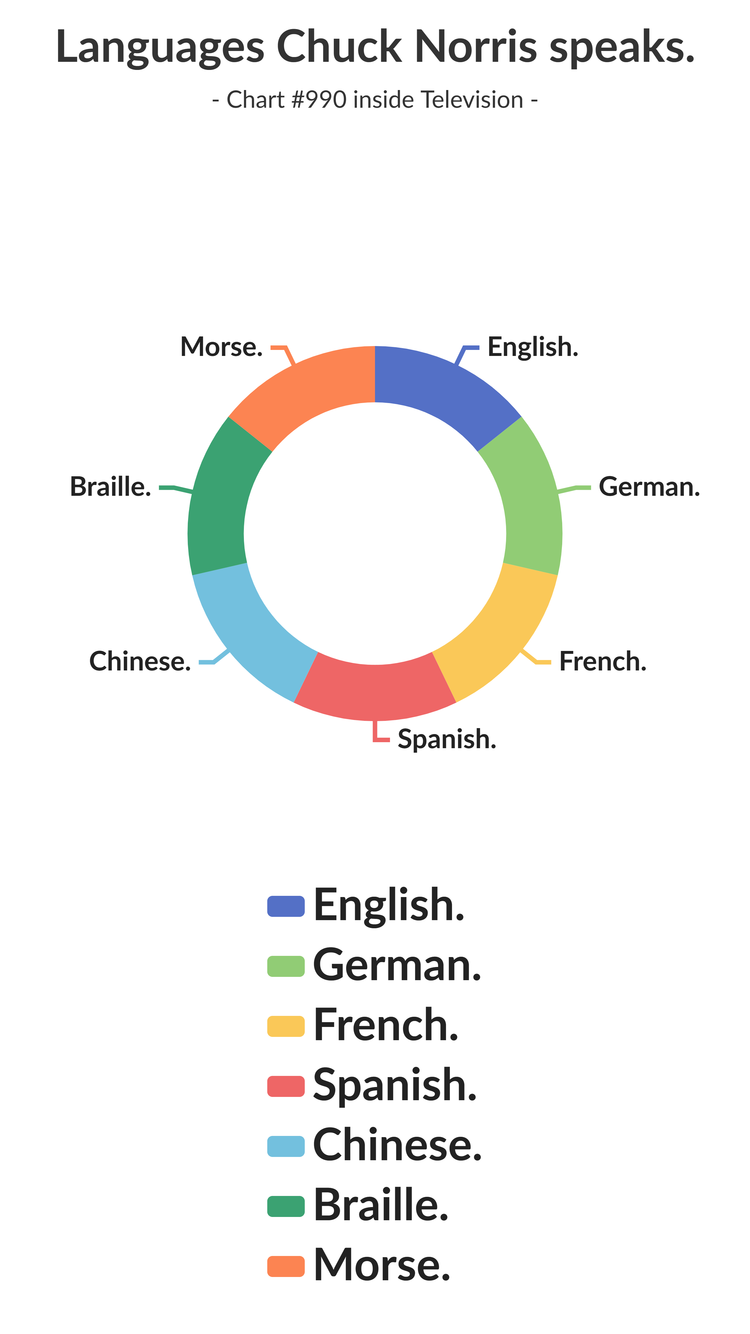
The holy book of charts. It's full of memes!
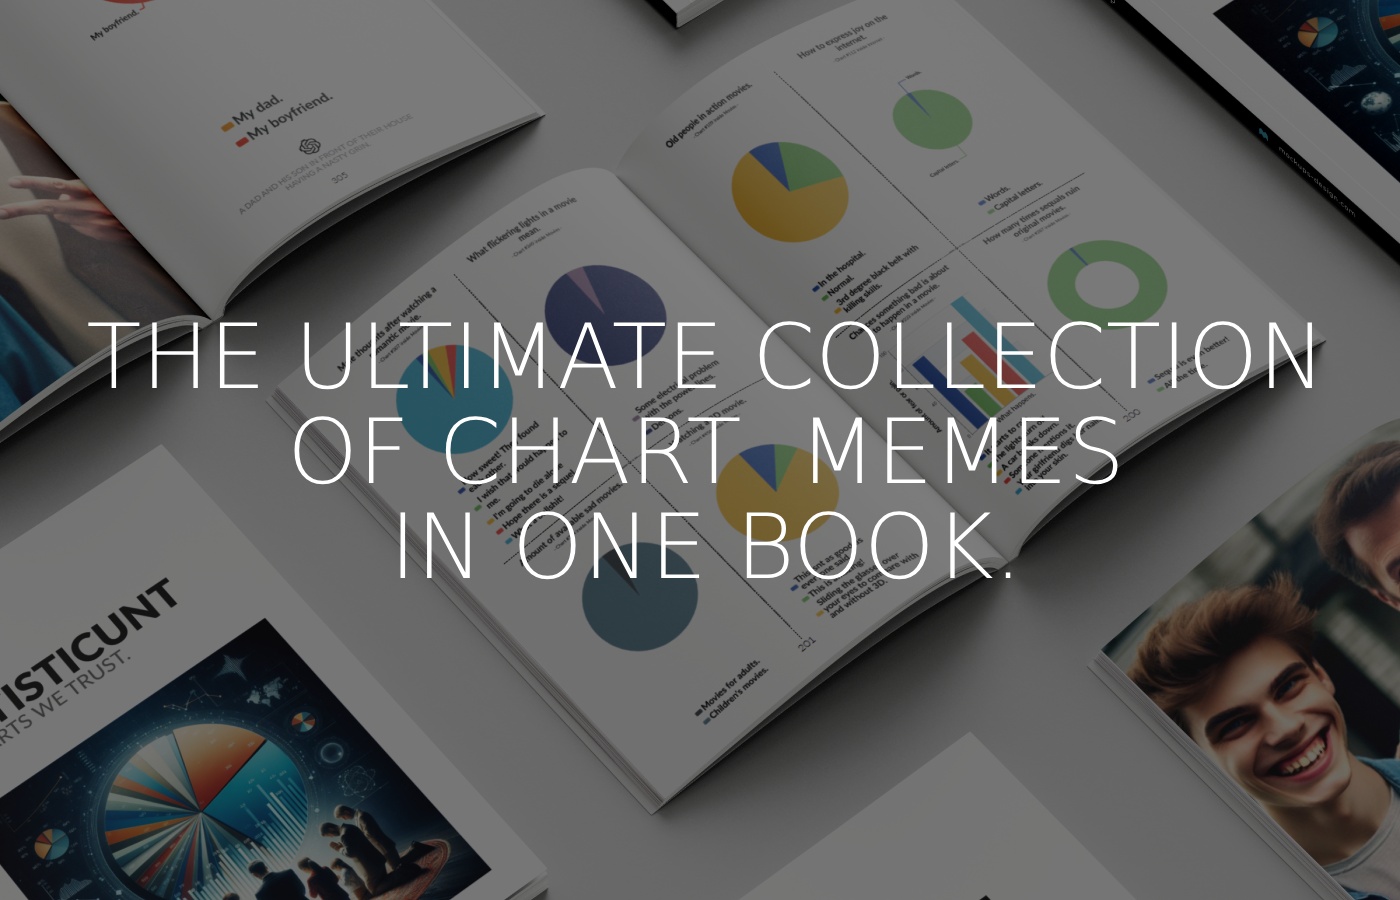
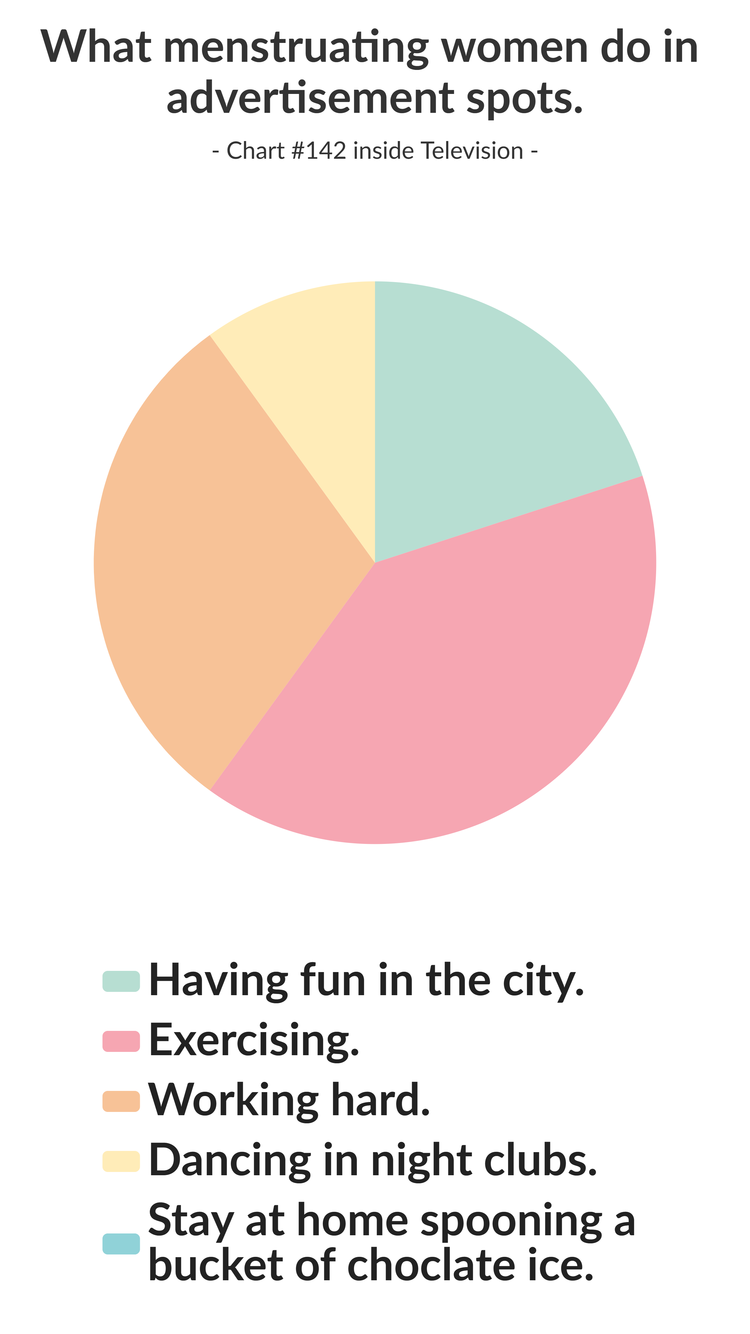
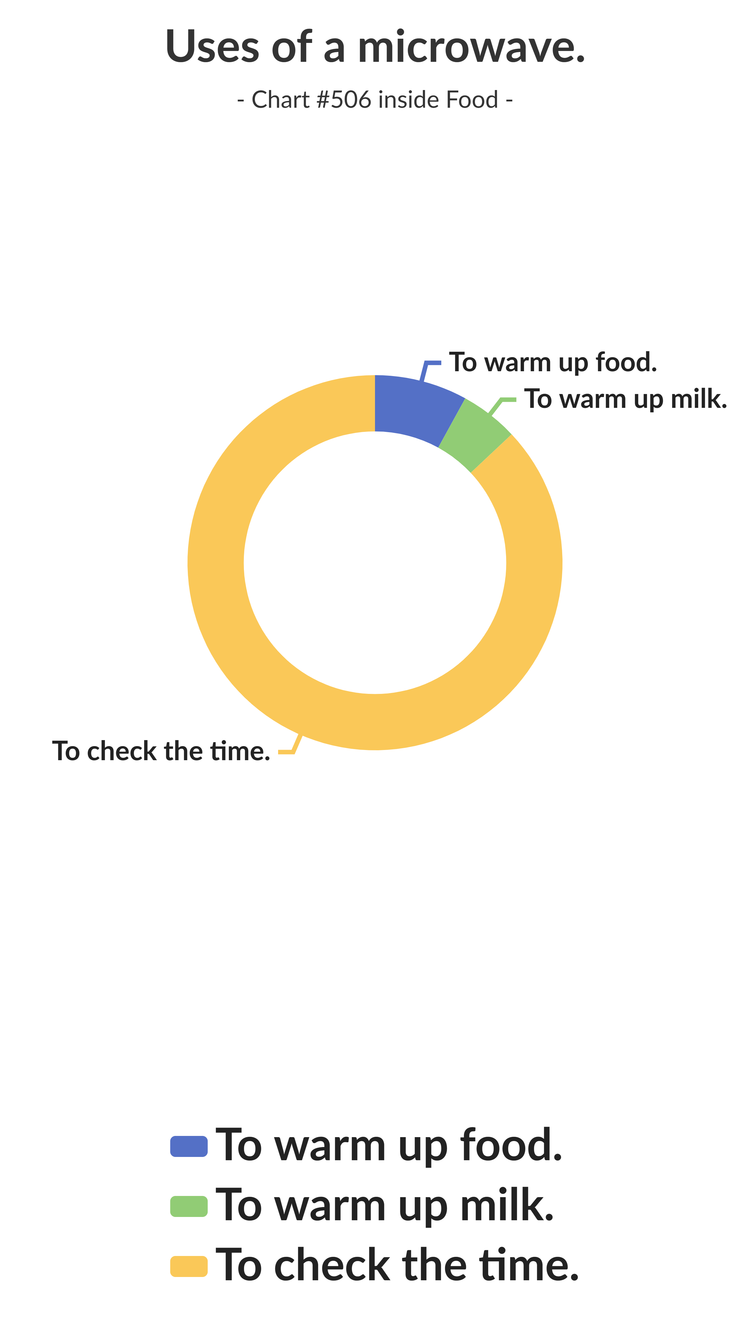
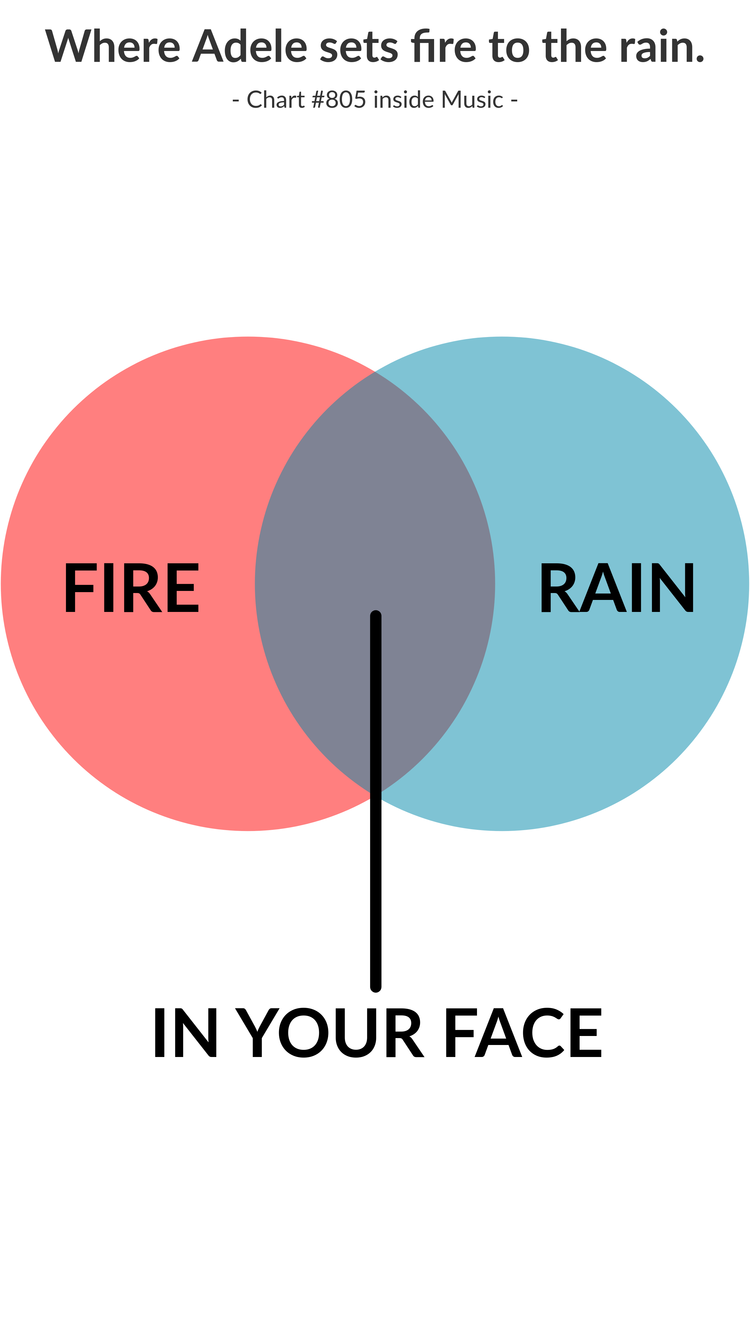
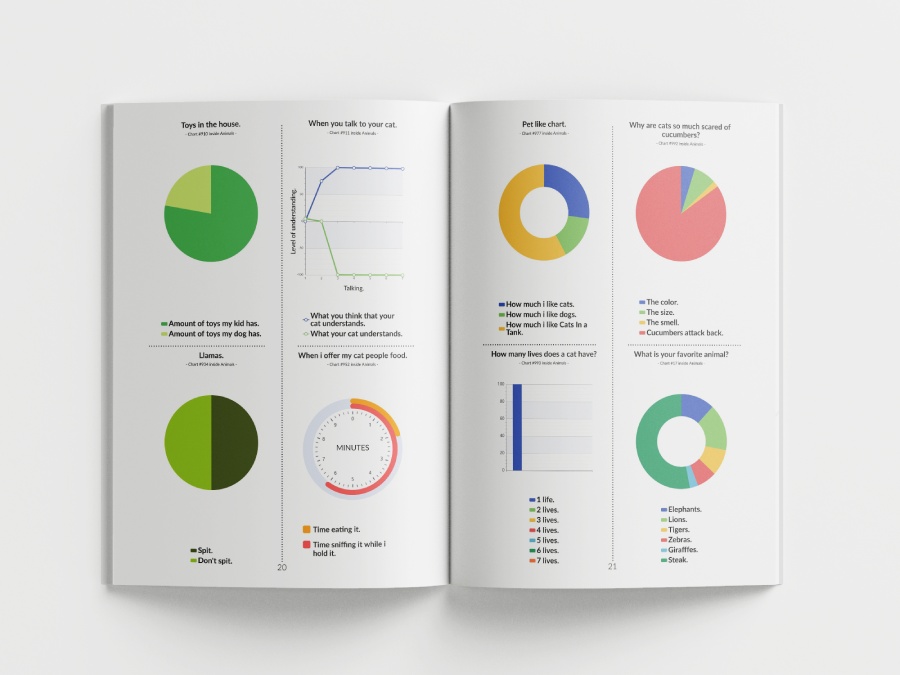
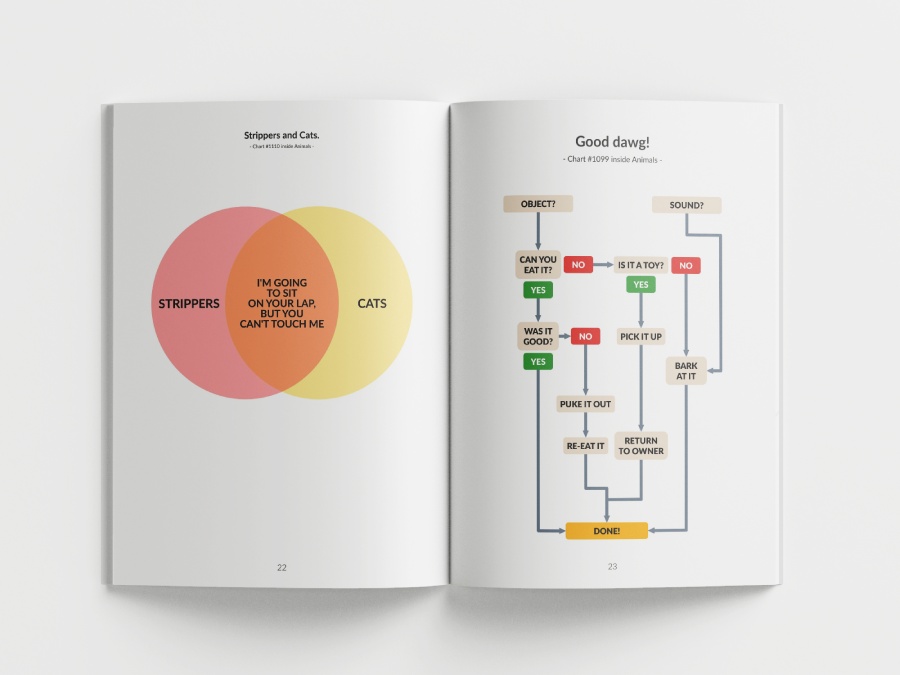
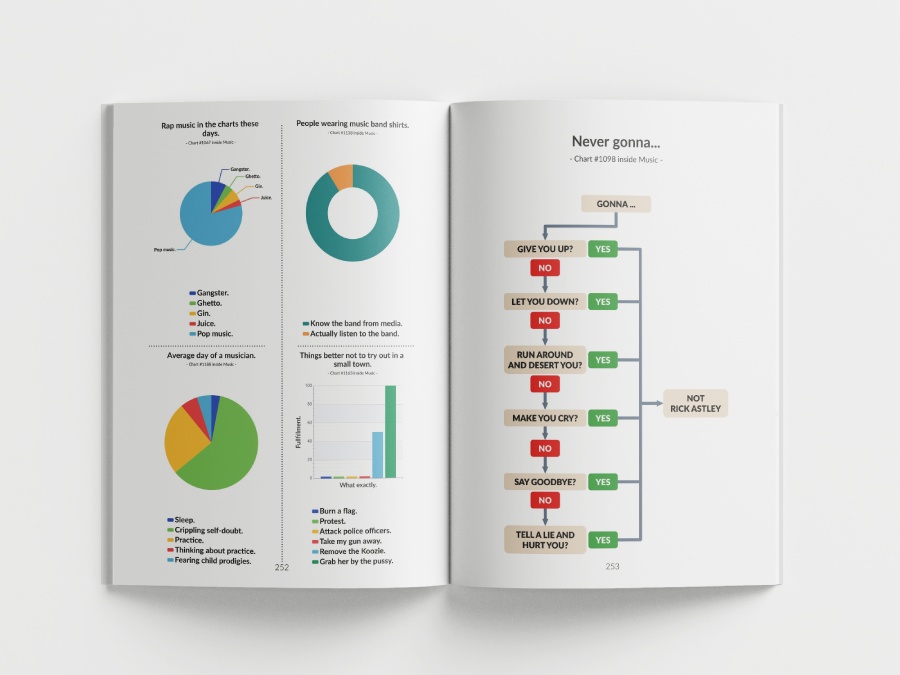
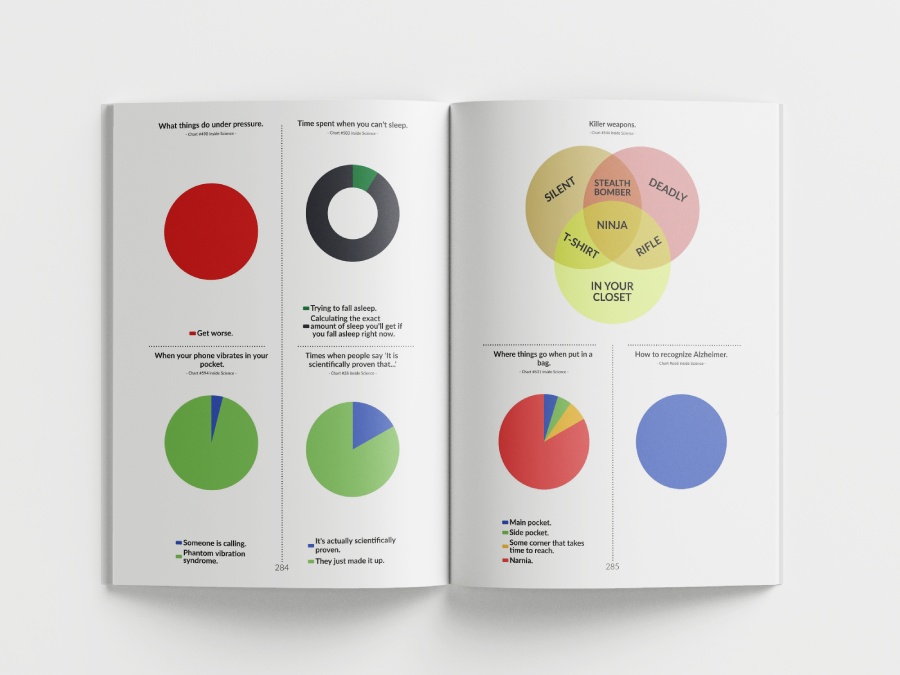
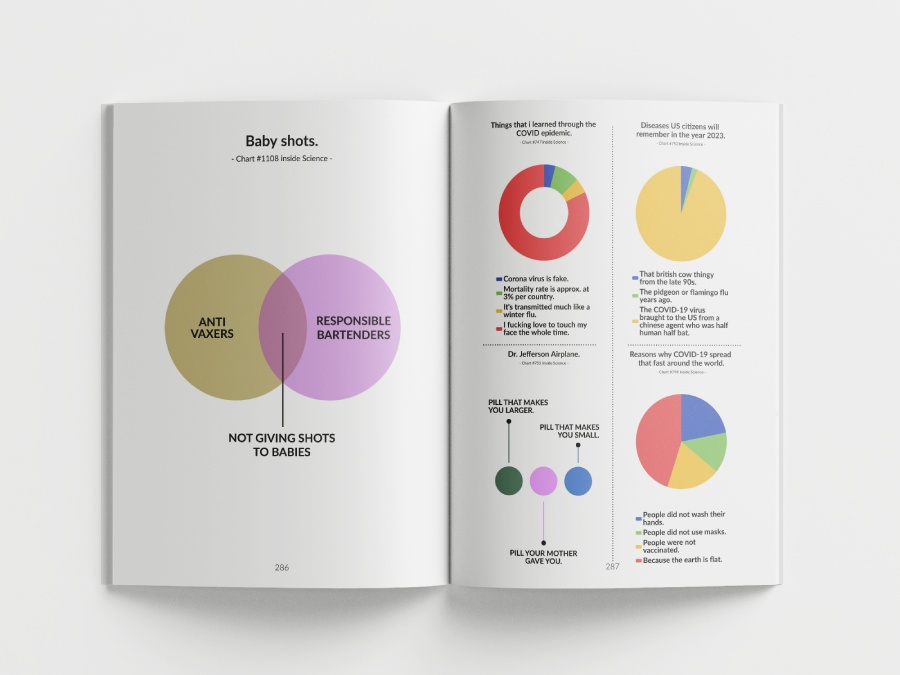
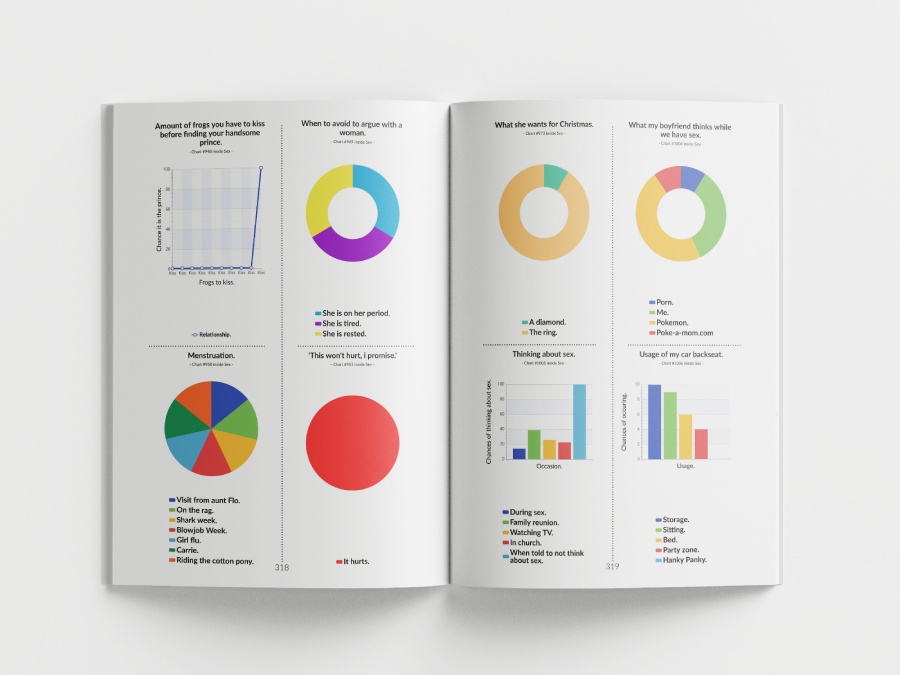
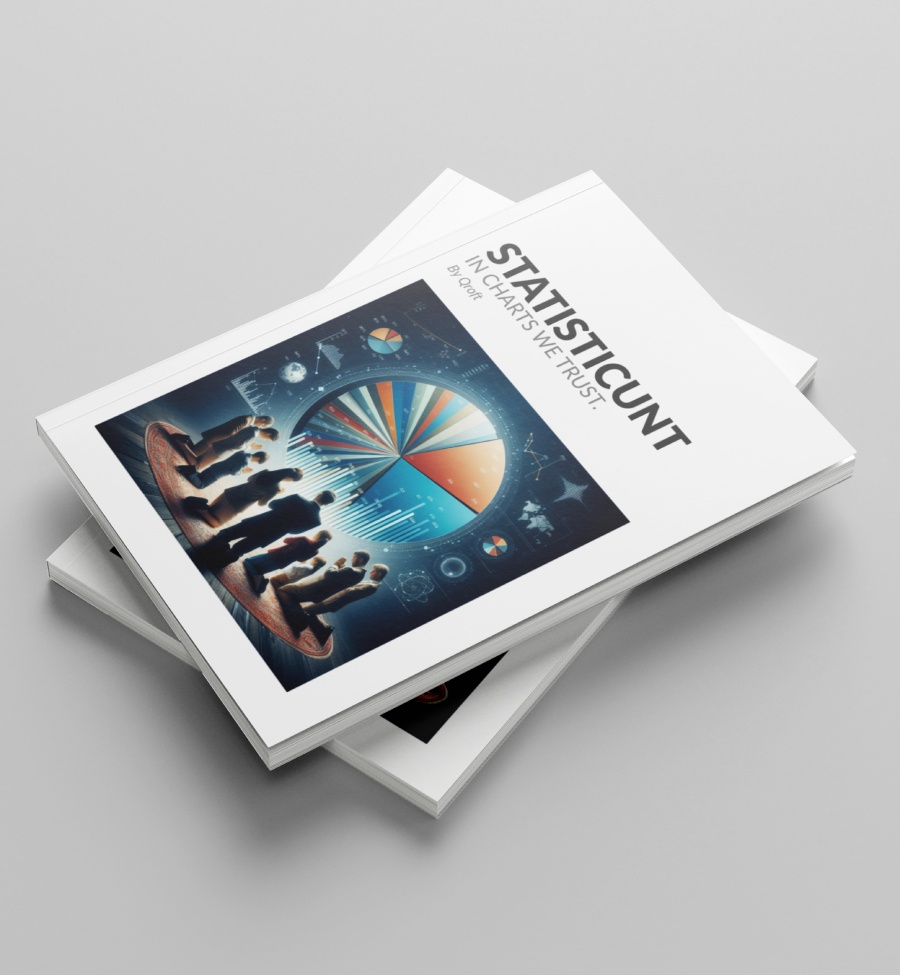
STATISTICUNT is a Wholesome Collection of hilarious chart graphics in the ultimate laughter-inducing book that will have you smile with its hundreds of funny charts spread over more than 440 pages! This comedic masterpiece showcases a delightful assortment of cleverly designed pie-charts and graphs, each ingeniously depicting various amusing scenarios and relatable everyday situations.Whether you're in need of a good chuckle or simply seeking a lighthearted read, "STATISTICUNT" guarantees a refreshing perspective on life's and society's little quirks. Get ready to dive into this laughter-filled journey packed with wittiness, wit, and whimsical charts - because laughter truly is the best pie!
STATISTICUNT is a comprehensive resource that serves as a fun guide for marketeers, analysts, content creators, and anyone seeking a visualized insight into various aspects of life.
While it does not guarantee finding all the answers one may be searching for, it can offer valuable information to help navigate in the right direction and gain a better understanding of life's complexities.

Please be advised that this book contains a lot of profanity, sexuality and side puns that might hurt your feelings, your thoughts or change your point of view on life, politics, sex, sports, earth or space Use this information wisely. But use it.
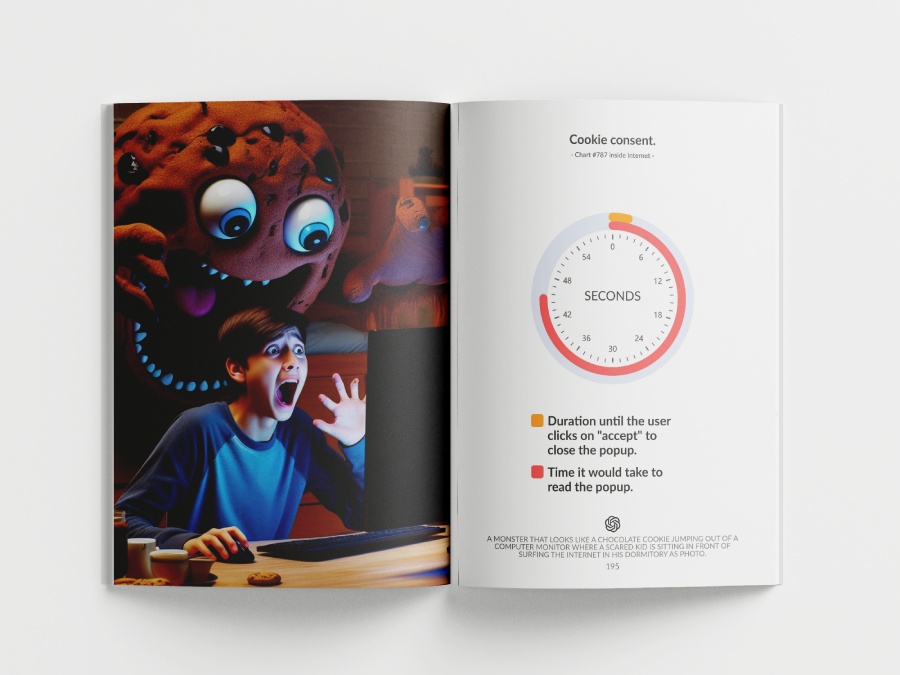



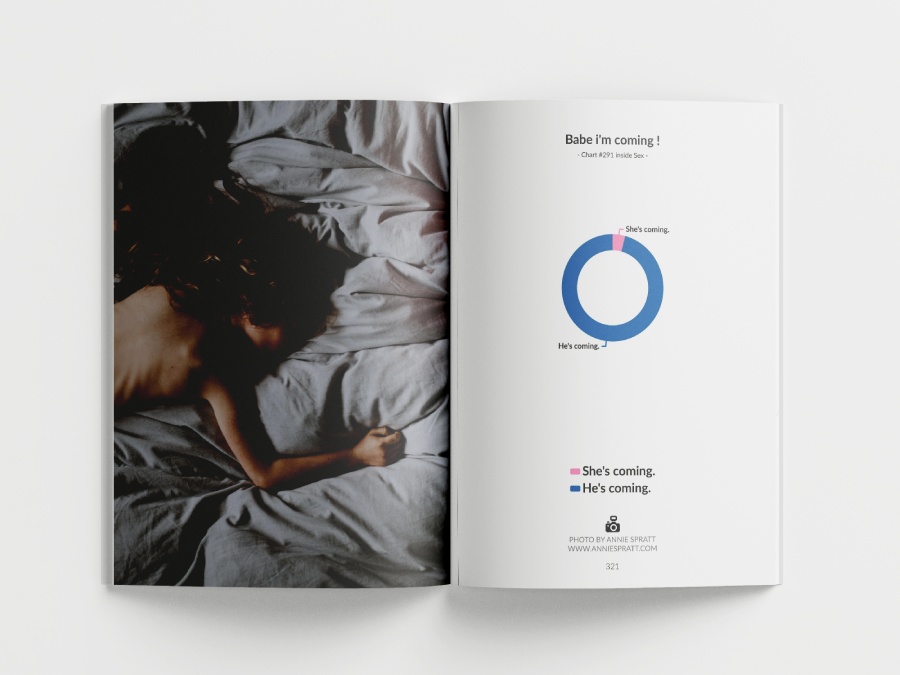
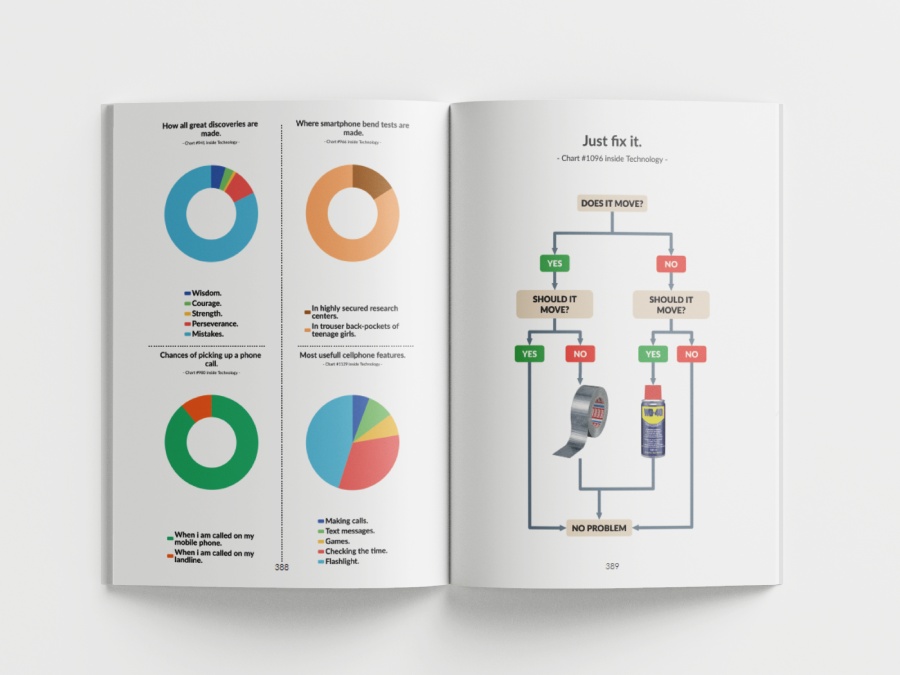
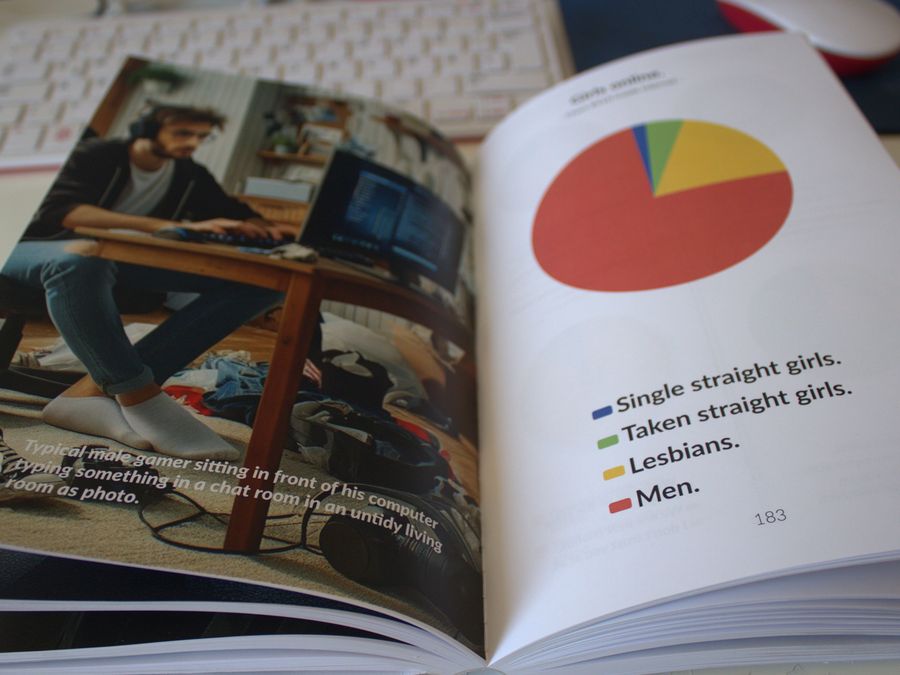

A.I. generated photos.
42 photos.
Inside STATISTICUNT are dozens of AI generated photos to visualize
individual charts either by its subject or its content.
Some of these images are outstanding and show the great potential
behind the technology, while others on the contrary show the limits of the
A.I.
A.I. generated photos inside the book can be recognized by the Dall-E
logo and the text that has been used to create the image through the
Microsoft Image Designer website.
Real photos.
11 real photos.
STATISTICUNT also contains a dozen of real photos to accompany individual charts.
These photos have been published at the unsplash.com website under a creative commons
license and are brought to you by the world’s most generous community of photographers.
Inside the book you will find photos by (in alphabetical order)
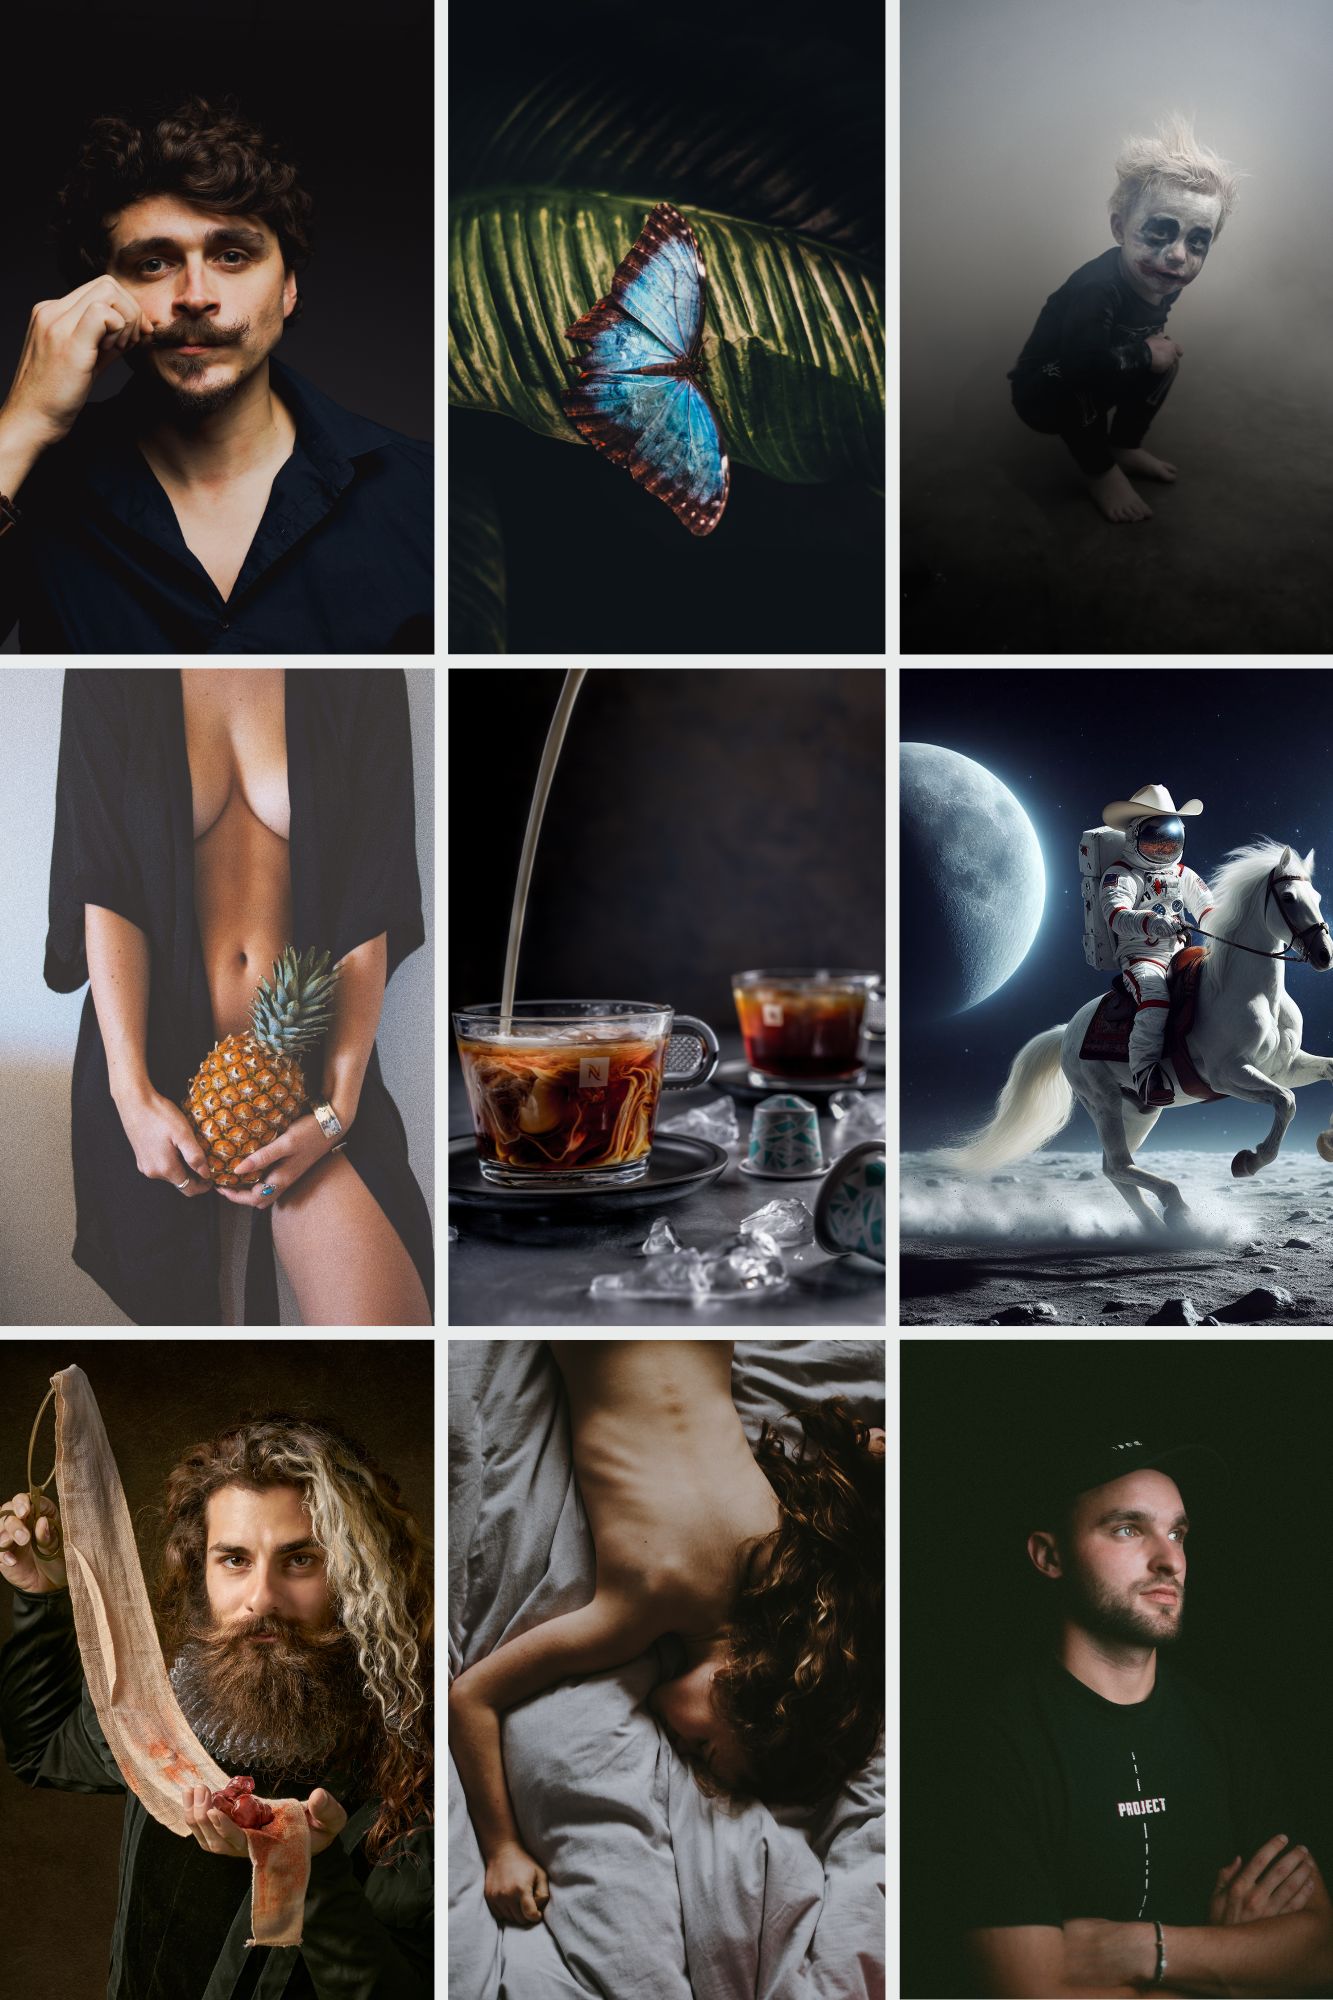
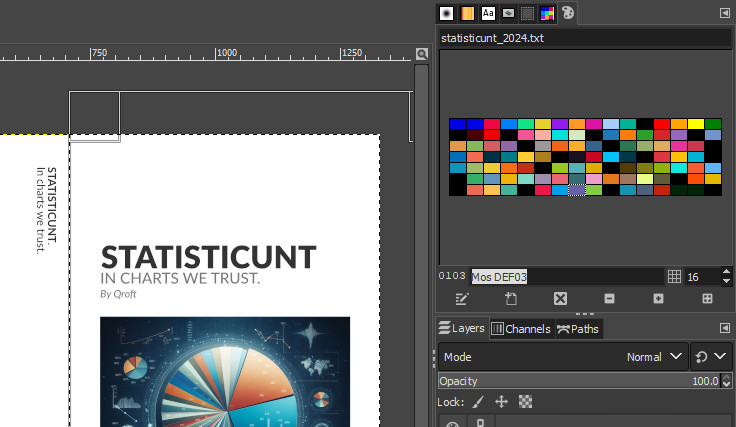
Chart color palettes.
At the end of the book there are two pages containing these color palettes that you can use for your next chart or MS Excel project.
You can import these files into the proper graphic design tool to have the colors available to be used within your project. More software will be supported in the future with the proper download options.
CREATED WITH


 Adrian Infernus
 Altin Ferreira
 Annie Spratt
 Helena Yankovska
 JJ Jordan
 Luca Vercellio
 Marvin Meyer
 Tata Zaremba
 Tom Prejeant
 Zachary Kadolph